Engineering studies for green hydrogen plants

Hydrogen plants are sized on one average price. They run on 8,760.

We design electrolysis plants, then run them hour by hour against a real year of prices and demand, so the plant that gets financed is the plant that will operate. Every figure carries its source.

One average price: 65.3 €/MWhThe same year, hour by hour: 8,760 prices

0151+ €/MWhbelow zero (556 hours)Rows: hour of the day, 00:00 at the top. Source: ENTSO-E Transparency Platform.

The problem

  1. 01

    Plants worth tens to hundreds of millions are sized in spreadsheets, on one average electricity price and an assumed capacity factor, which alone can change the installed power two to three times.

  2. 02

    Storage is sized by rule of thumb, a fixed number of hours, instead of by how the plant will actually run against prices and demand.

  3. 03

    Owners and lenders receive cost figures they cannot trace to a source.

So we built the software to do it properly, and we deliver it as engineering studies, with an engineer on every one.

The method

From an optimum on paper to a plant that runs.

Four steps on one cost basis, in our own software. The snapshots are the H2 Optimization Suite on an illustrative project: a 20.6 MW plant supplying a flat 300 kg of hydrogen an hour, run against Spain's 2025 prices.

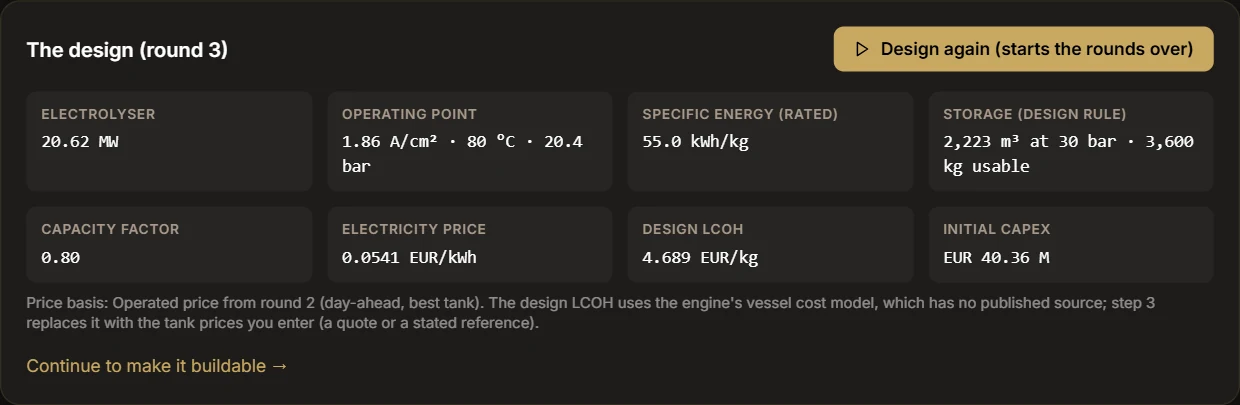
  1. The design step of the H2 Optimization Suite, round 3: a 20.62 MW PEM electrolyser at 1.86 A/cm², 80 °C and 20.4 bar, 55.0 kWh/kg, storage of 2,223 m³ at 30 bar with 3,600 kg usable, capacity factor 0.80, design LCOH 4.689 EUR/kg.

    Step 1 · Design

    Size the whole plant at once.

    An optimiser built on electrochemistry and thermodynamics sizes the electrolyser, compression, cooling and storage together for your demand, site and finance. Current density, stack temperature and outlet pressure are searched at the same time, with the stack priced by its active area, and the capacity factor is stated with its source.

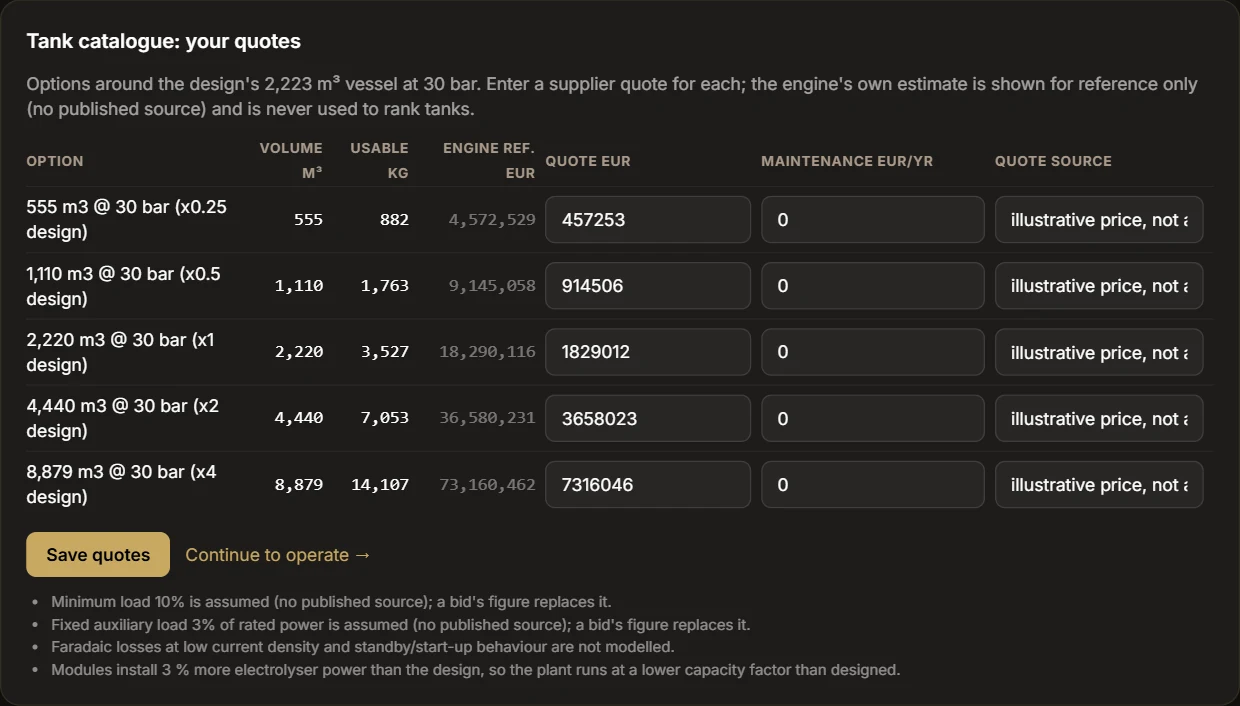
  2. The tank catalogue: five vessels from 555 to 8,879 m³ at 30 bar, each with its usable hydrogen, the engine's reference cost and a price marked illustrative, not a quote.

    Step 2 · Make it buildable

    From an optimum to equipment you can buy.

    The design becomes commercial modules with the stack's own efficiency curve, and the supplier's minimum load, ramp rate, start-up cost and standby draw. Tanks are priced from your suppliers' quotes or a stated reference. The engine's own estimate is shown for reference, noted as having no published source, and never used to rank them.

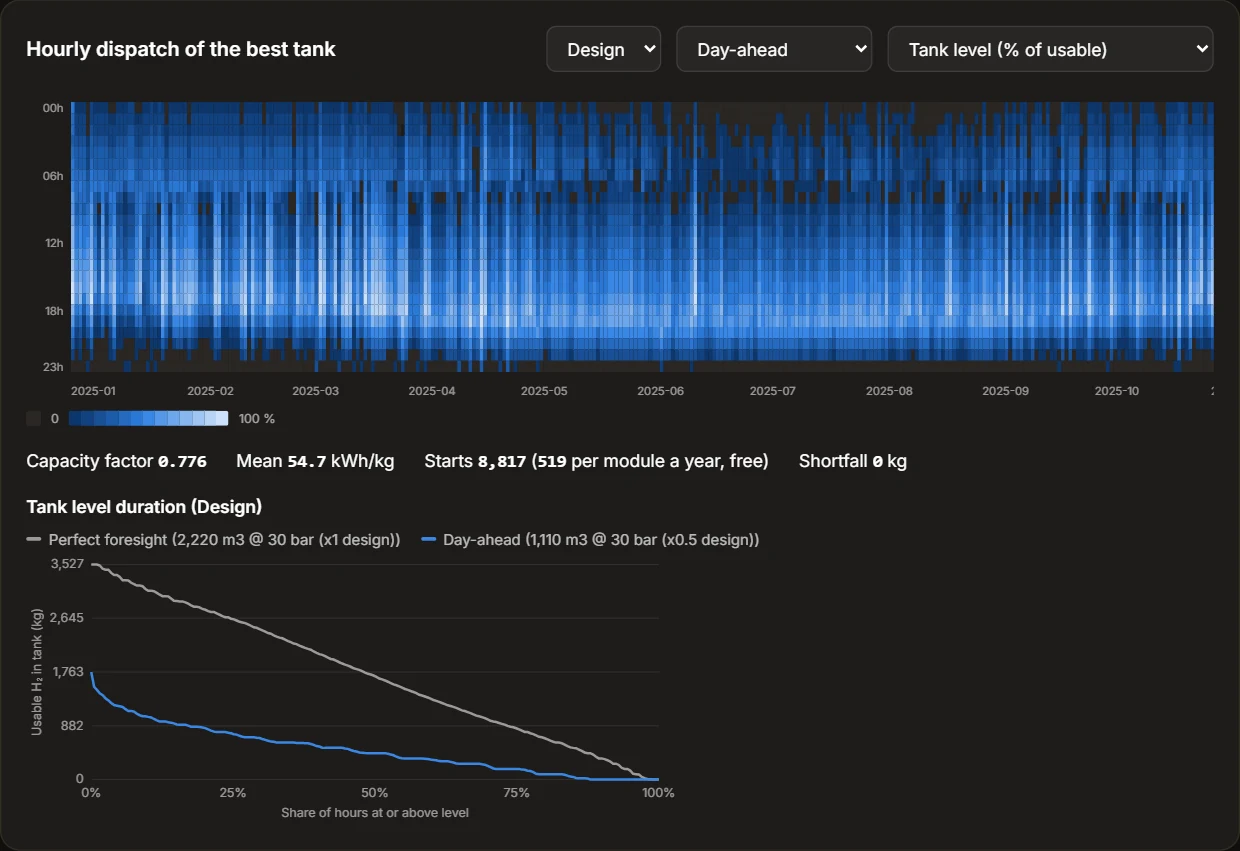
  3. Hourly dispatch of the best tank through 2025: a heatmap of the tank level, hour of the day against day of the year, the starts and energy per kilo, and how often the tank sits at each level.

    Step 3 · Operate

    Run it for a year, hour by hour.

    Every tank option is dispatched against 8,760 hours of real market prices and your demand: once with perfect foresight, the lowest cost possible, and once day-ahead, as an operator would plan it. Storage is chosen by the cheapest year, not a rule of thumb, and the study shows when the plant stops, when it turns down and how often each module starts.

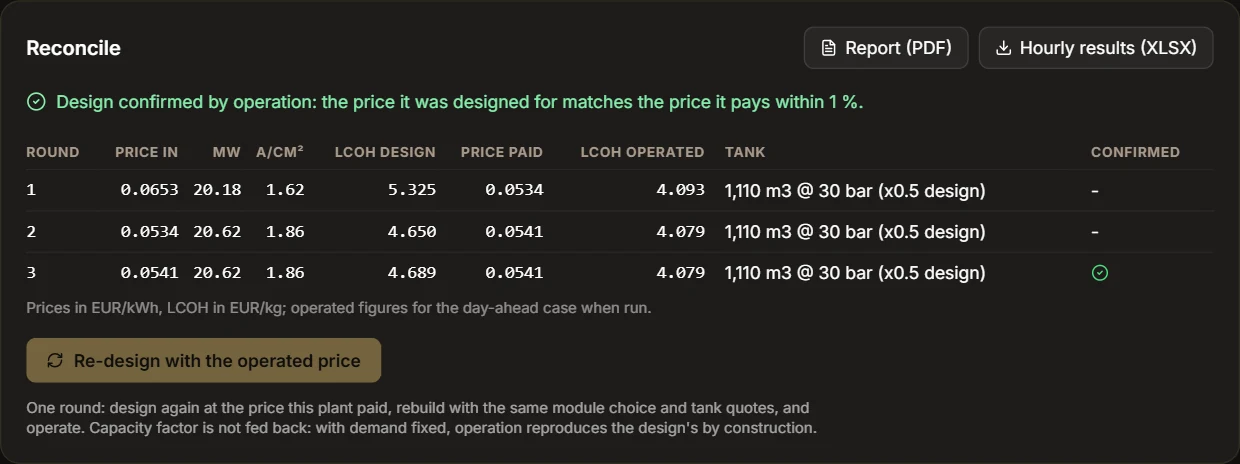
  4. Three reconciliation rounds: round 1 designed at 0.0653 EUR/kWh paid 0.0534; round 2 designed at 0.0534 paid 0.0541; round 3 designed at 0.0541 paid 0.0541, confirmed.

    Step 4 · Reconcile

    Design again at the price it actually pays.

    Operation moves production into cheaper hours, so the plant pays less than the average it was designed on. The design is redone at the price it paid, and the rounds stop when the two agree.

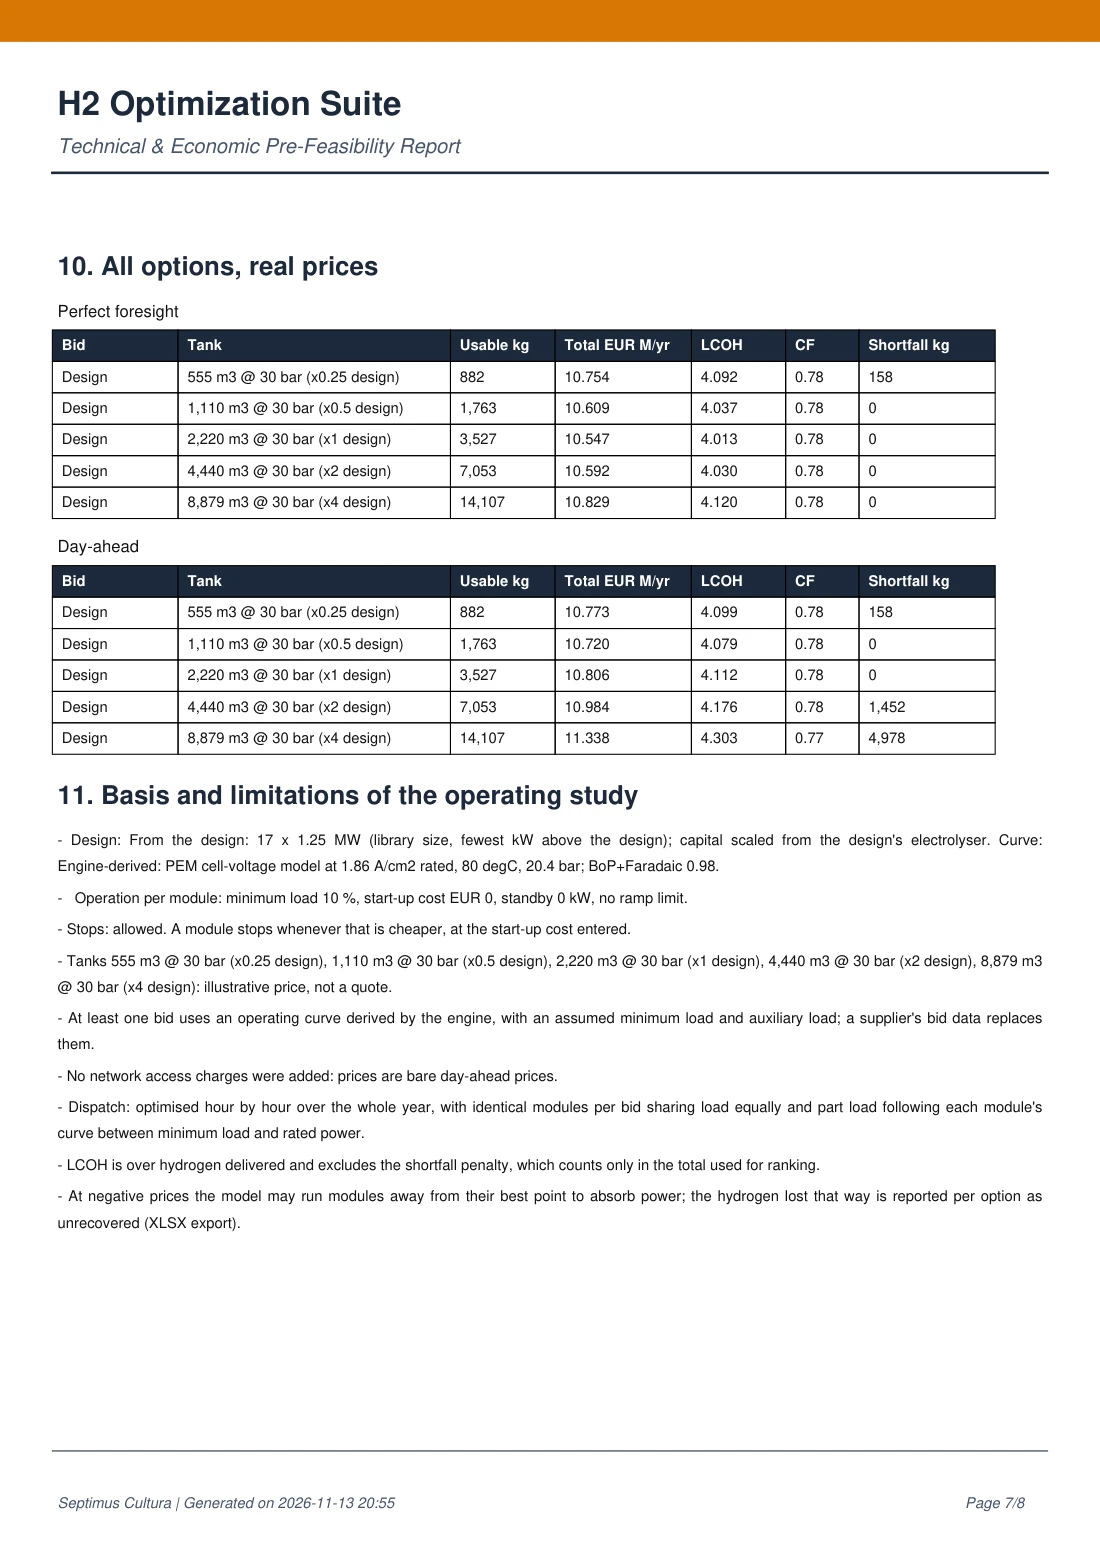
  5. A page of the report: the section 'Basis and limitations of the operating study', listing each assumption, the operating settings of the modules, and which values have no published source.

    Done

    A plant you can defend.

    The report carries every figure's source: the price data, the efficiency curves, the quotes. Anything without a published source is named as such, not hidden, so the reader knows exactly what to check.

The gold line is a tank through 2025, January at the top: it swings right as the tank fills and left as it empties. Illustrative: 17 x 1.25 MW PEM, flat 300 kg/h demand, 1,110 m3 @ 30 bar (x0.5 design) with a 10 bar delivery minimum, day-ahead dispatch (round 3 of the illustrative Design & Operate project).

Questions operators ask

The questions that decide how a plant runs.

Every study answers them on the plant's own year of prices, from the same engine and cost basis. The snapshots are the illustrative project above.

01

Run the stack gently, or hard?

Lower current density saves electricity per kilo but needs more stack for the same hydrogen. Every design shows the cost per kilo against current density at its own electricity price, at half and at double, so you see where the optimum sits and how flat the curve is around it. In the illustrative plant the optimum moves from 2.0 A/cm² with cheap power to 1.25 A/cm² with dear power; running fewer hours pushes it up.
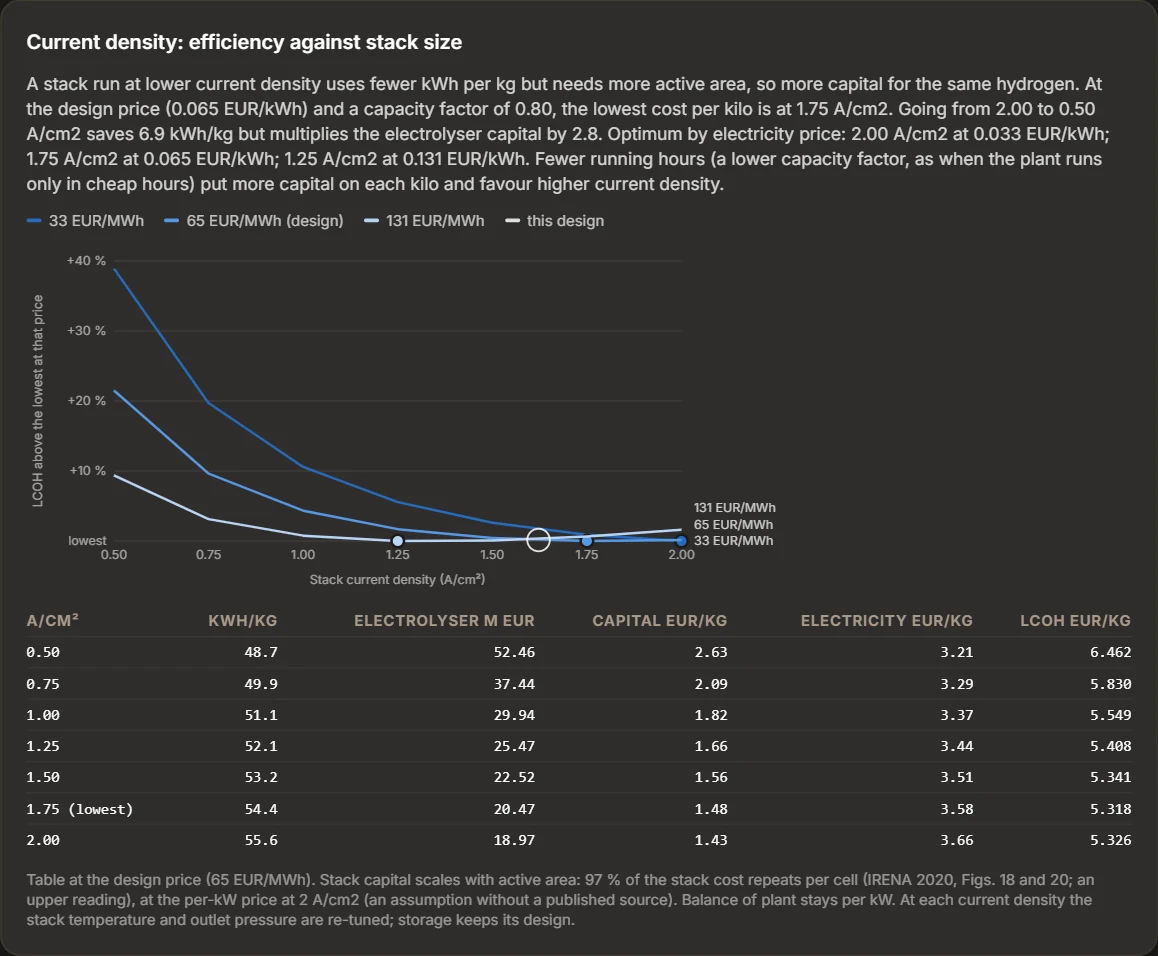
Cost per kilo against stack current density at 33, 65 and 131 EUR/MWh, each against its own lowest point: the lowest sits at 2.00, 1.75 and 1.25 A/cm². Below, a table of energy per kilo, electrolyser capital and cost per kilo at the design price.

02

Stop in expensive hours, or turn down?

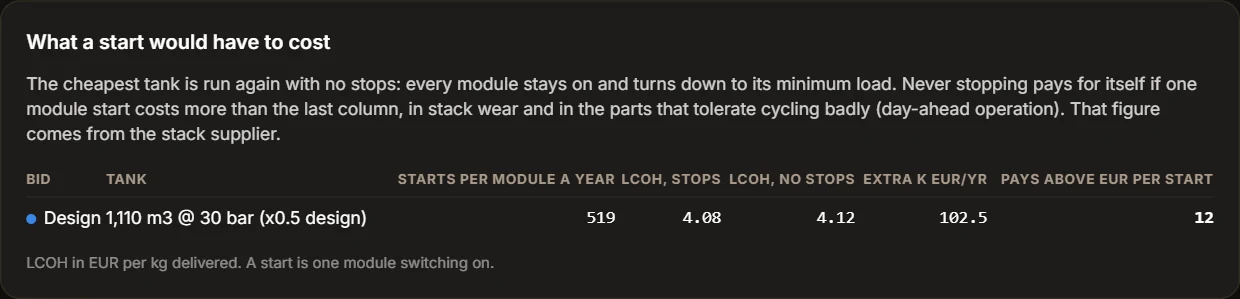
Each study runs the plant both ways: free to stop, and never stopping, with every module turned down to its minimum load. It reports how often each module starts and the cost of one start above which never stopping pays for itself, to set against your stack supplier's figure for wear. Minimum load, ramp rate, start-up cost and standby draw come from the bid.

What a start would have to cost: 519 starts per module a year; 4.08 EUR/kg with stops, 4.12 without; never stopping pays for itself if a module start costs more than about 12 EUR.

03

When does the plant actually run?

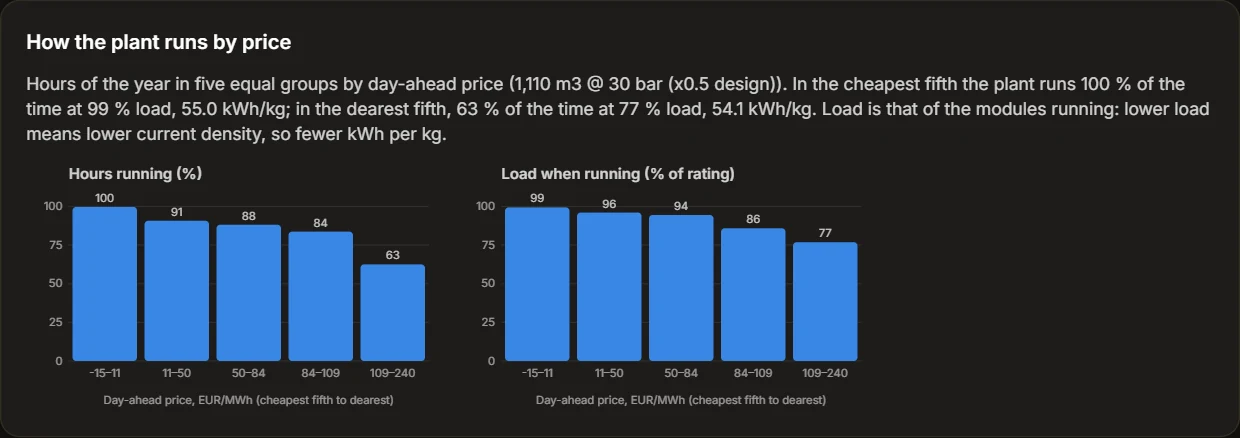
The hours of the year are grouped by price. For each group the study shows how often the plant runs, the load of the modules running and the electricity per kilo: a module at lower load runs at lower current density, so it uses less. In the illustrative plant it runs in every one of the cheapest hours and in 63 % of the dearest, at lower load.

How the plant runs by price: in the cheapest fifth of hours it runs all of the time at 99 % load; in the dearest fifth, 63 % of the time at 77 % load.

Renewable fuels need innovative tools.

So we build them. From physics and real market data, we size hydrogen plants on the year they will actually run, and we show where every number came from.

Optimum per scientiam.The best result, through knowledge.

Our story

Use cases

Every study ends in a decision someone has to defend.

Industrial offtake · Spain

Storage and bid selection for a green steel plant

Which electrolyser bid, and how much storage?

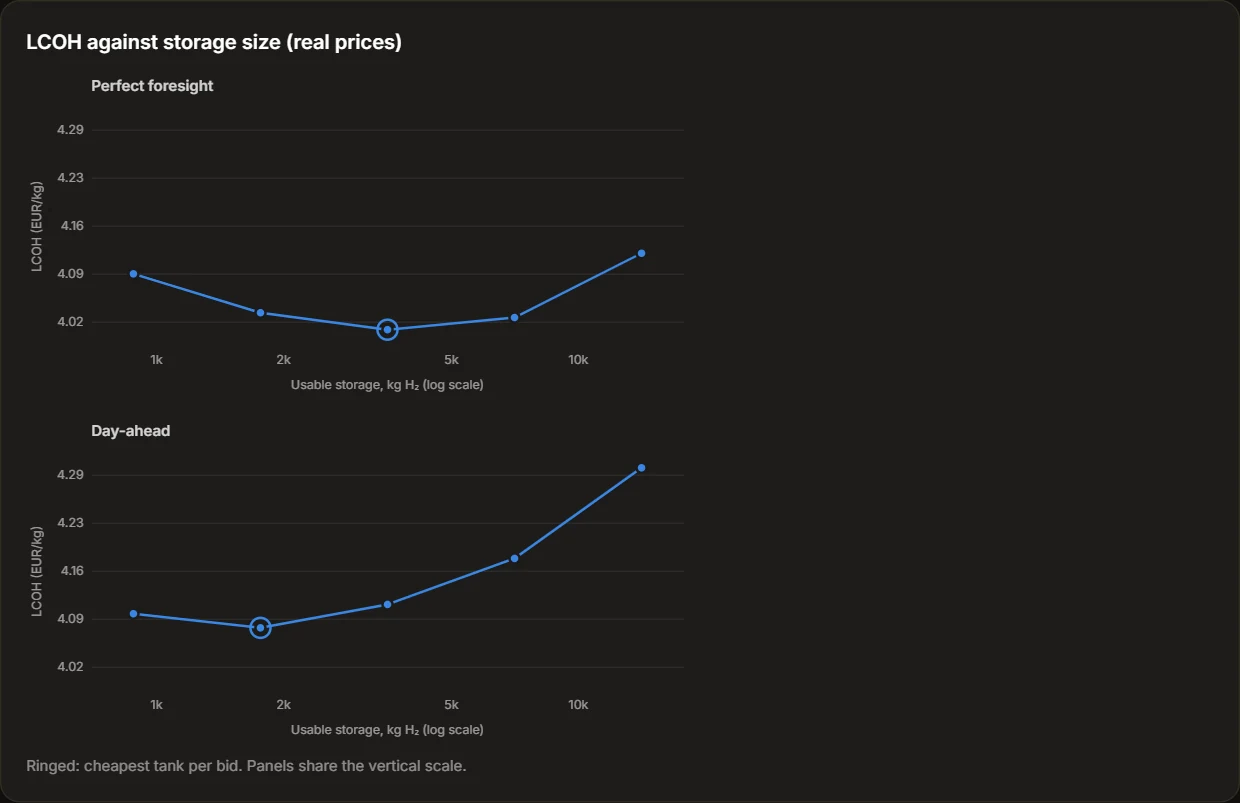
Each bid's modules and efficiency curve are run with every tank the suppliers quoted, against the year's prices and the steel plant's production schedule. The answer is the cheapest combination, shown with perfect-foresight and day-ahead results side by side, and what a missing kilo would have to cost before a larger tank pays for itself.

Cost of hydrogen against usable storage, perfect foresight and day-ahead: each curve has a minimum, ringed, at a different tank size.
Cost of hydrogen against storage size, illustrative project. The cheapest tank differs between perfect foresight and day-ahead.

Project finance

Independent review for lenders and investors

Is the developer's cost of hydrogen credible?

We rebuild the plant's cost from first principles and compare it with the developer's model line by line, ranked by the size of each gap. Every difference is named, not averaged away.

Developers

Early feasibility

Is this project worth a FEED study?

A sized plant, its capital and operating costs and its cost of hydrogen, from demand, site, prices and finance, with the capacity factor stated and sourced, and the limits written down.

Solar or wind

Plants coupled to renewables

Off-grid, or with a grid connection?

The plant runs on an hourly solar or wind profile at its PPA price, with or without grid top-up. Each option shows how much of its electricity came from the profile and how much was curtailed.

Operating plants

Stack replacement timing

Replace the ageing stack now, or a better one later?

Stack degradation and efficiency improvements are priced against each other, so the replacement year is chosen on cost rather than a warranty date.

One year, two rounds · illustrative

What a year of real prices changed.

Electricity price paid against the design
−18 %

paid for electricity, against the average the design assumed

Storage chosen against the design rule
½

the tank the design rule had sized, chosen by day-ahead operation

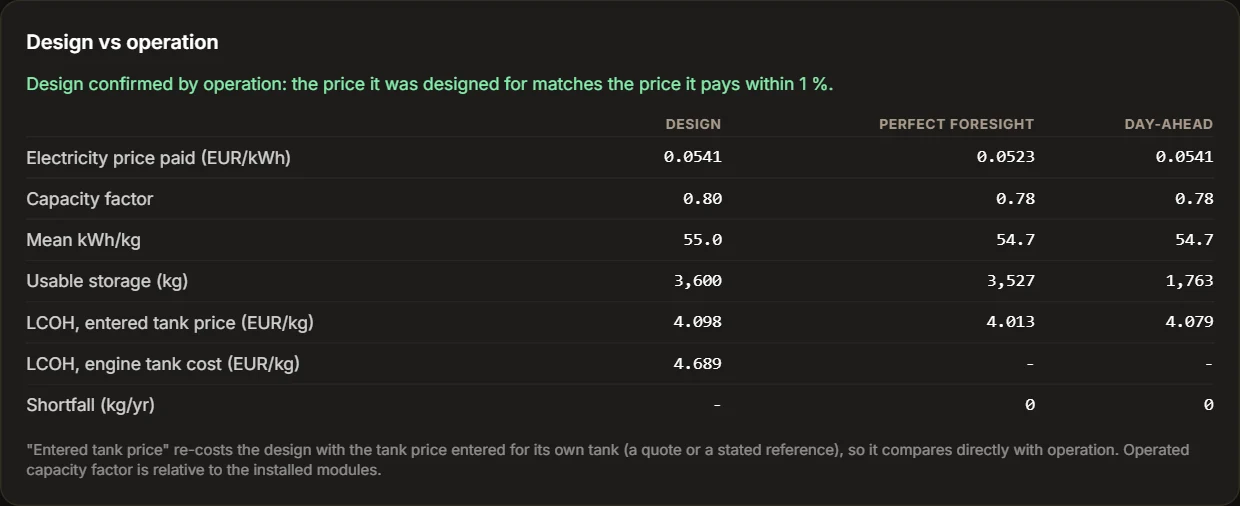
A 20.6 MW PEM plant, designed for a flat 300 kg/h offtake at Spain's 2025 average price and a capacity factor of 0.80, then run day-ahead against the real year. Operation moved production into cheaper hours. Round three, designed at the price actually paid, was confirmed within 1 %.

Illustrative: the tank prices are not supplier quotes, so its cost of hydrogen is not a client figure.

Design against operation, round three: electricity price 0.0541 EUR/kWh designed, 0.0523 paid with perfect foresight, 0.0541 day-ahead; usable storage 3,600 kg designed, 3,527 and 1,763 kg operated.
Round three: design against operation, perfect foresight and day-ahead.

Evidence

What we checked, and what we withdrew.

The engine was run on the published inputs of three plants, DOE Record 24005 (USA), Sinopec Kuqa (China) and the Port of Klaipėda (Lithuania), and triangulated against IEA and IRENA reference assumptions, with nothing tuned between cases. The back-test is a script in the codebase: anyone with the code gets the same numbers. Revision 4, in November 2026, reran it with electrode kinetics that follow stack temperature.

5–9 %

conservative cell voltage

At the operating point DOE published (2 A/cm²) the engine gives 2.00–2.08 V against DOE's 1.9 V, across the 60–80 °C DOE leaves unstated. It is the one check that is neither circular nor a design choice.

0.47×

DOE's cost, every euro attributed

On DOE Record 24005's own boundary, in 2022 euros: €3.23/kg against €6.93/kg. Swapping in DOE's assumptions one at a time closes the gap: capital +1.81, O&M +0.54, financing +0.46, replacements +0.17, energy and degradation +0.05, after-tax effects +0.67. Averaged over every order of substitution, capital explains 71 % of the gap. The engine prices electrolysers on competitive supply; under European EPC terms their capital roughly doubles, and our reports say so.

€553/kW

electrolyser capital, at scale

At the bottom edge of the IEA's USD 600–1,200/kW band for electrolysers made and installed in China, the basis the engine declares.

51.2–57.5

kWh/kg, the references' own spread

IRENA and DOE disagree by 12 %. The engine's PEM case (56.5) and alkaline case (54.2) both fall inside, with each stack run where its cost is lowest. Explained, not validated.

Withdrawn, and why

Results we published or used before, and no longer stand behind. They are listed here rather than quietly deleted.

0.53× DOE
It mixed boundaries and currencies. The correct figure, on DOE's own boundary, is above.
0.43× DOE
Restated as 0.47×: one currency year, and the stack priced by its active area.
A 47,304-hour stack life
A rounding artefact. The model gives about 37,200 hours for PEM.
“Specific energy validated”
It is explained by the operating point the optimiser chooses, not validated.
Storage cost from the engine
It has no published basis. Client studies use supplier quotes.

Our story

Built in Spain, one test at a time.

Septimus Cultura, a Swedish AB under formation with its engineering in Spain, was founded by Brandon Onuoha, a chemical engineer, to build the tools renewable fuels need: software that sizes hydrogen plants from physics and real market data rather than averages, delivered as engineering studies and checked in the open.

Brandon Onuoha speaking at a lectern at VLC Green Energy '26, in a hall with carved wooden panelling.
Brandon Onuoha at VLC Green Energy ’26, Cámara Valencia. Photo: Eva Ripoll.
  1. March 2026

    Septimus Cultura goes public, with a first version of the engine.

  2. April 2026

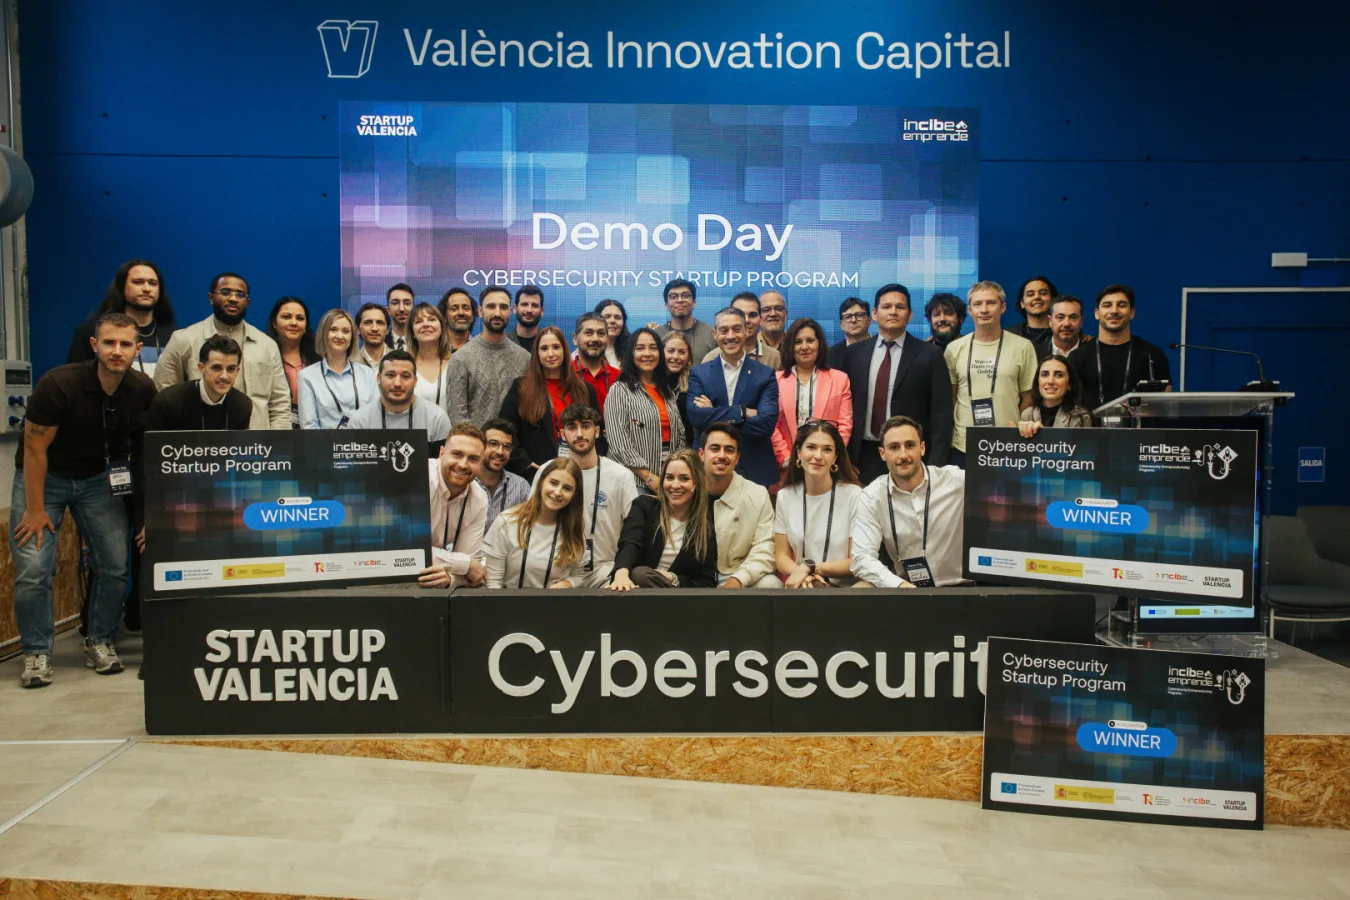
    Incubated by Startup Valencia with INCIBE Emprende: Septimus Cultura is listed among the ten startups at the programme's third Demo Day, on 9 April.

    Group photograph of founders and organisers on stage at a Startup Valencia and INCIBE Emprende Demo Day.
    Image published by INCIBE with its announcement of the Demo Day, which lists “Septimus Cultura de Brandon Onuoha Onyeri” among the participating startups. Source: incibe.es
  3. April 2026

    The H2 Optimization Suite: electrolyser physics, compression, storage and costs in one engine.

  4. September 2026

    We reviewed our own engine line by line, corrected its physics, sourced its degradation rate from DOE, and withdrew the headline result an earlier version had produced.

  5. October 2026

    A reproducible back-test against three published plants, and one cost basis for every figure.

  6. October 2026

    Hourly operation: storage sized against a real year of prices and demand, designs reconciled with how they run, and plants coupled to solar or wind.

  7. November 2026

    The questions operators ask, answered in every study: how hard to run the stack, whether to stop or turn down in expensive hours, and what a start or a missing kilo would have to cost. Electrode kinetics now follow stack temperature, and the back-test was rerun with them (revision 4).

  8. Next

    The first client storage study; an hourly-matching check for renewable hydrogen; daily operating plans for running plants.

Supported by

Universitat de ValènciaStartup ValenciaINCIBE Emprende

Talk to an engineer

Tell us the decision you are facing.

You will reach an engineer, not a sales team. Tell us where the project is and what has to be decided; we will reply with how a study would answer it, the data it needs and how long it takes.

Or write to brandon@septimuscultura.com